
Journal of Environmental and Agricultural Sciences (JEAS). Nkurunziza et al., 2019. Volume 20: 1-20
Open Access – Research Article
Influence of the Mascarene High on October-December Rainfall and their Associated Atmospheric Circulation Anomalies over Rwanda
Idrissa F. Nkurunziza 1 , Tan Guirong 2 , Jean Paul Ngarukiyimana 2,*, Celestin Sindikubwabo 3
1 Key Laboratory of the Atmospheric Composition & Optical Radiation, CAS, School of Earth & Space Sciences, University of Science & Technology, Hefei, China
2 Key Laboratory of Meteorological Disaster, Ministry of Education (KLME)/Joint International Research Laboratory of Climate & Environment Change (ILCBC)/Collaborative Disasters (CIC-FEMD), Nanjing 210044, China
3 Key Laboratory of Arid Climate Change & Disaster Reduction of Gansu Province, College of Atmospheric Sciences, Lanzhou University, Lanzhou, Gansu, China
Abstract: This study aims to understand the influence of the Mascarene High (MH) on October to December (OND) rainfall and their associated atmospheric circulation anomalies in East Africa (EA) region with a focus on Rwanda. The relationship between Mascarene high indices and rainfall over the study area was revealed. The Mascarene East Ridge index presented significant correlation (r=0.53) with OND rainfall. Further investigation indicated that MH moves eastwards from its normal position, the rainfall was abnormally increased while when MH moves westwards from its normal position the rainfall deficit were noted over the study region. Associated atmospheric circulation anomalies (wind, velocity potential, sea surface temperature) show a close relation with the zonal movement of the Mascarene eastern ridge. The region was dominated by westerly winds at a lower level (850hPa) and easterly wind at high level (200hPa) during eastwards movement of MH. As the MH moves to east it gets weakened; the southerlies wind advected moisture from western equatorial Indian Ocean and reached Rwanda after being deflected by mountain Kenya and Kilimanjaro as north easterlies and easterlies converging with westerlies from Congo airmass. While during the westward position, the reverse was observed. Wet years i.e. 1997, 2002 and 2006 occurred when the MH moves eastwards, peaking in 1997 where it extends up to 10°E of its normal position; while the dry years i.e. 1981, 1993, 1996, 1998, 2005 coincide with west MH movement. Sea surface temperature over Indian Ocean and Mascarene East Ridge were positively correlated with significance level higher than 0.05 level. It was noted that when the Mascarene East Ridge moves to the East position, the Sea surface temperature gets warmer (positive anomaly) and cooler (negative anomaly) during West position.
Keywords: Mascarene High, East ridge, rainfall, East Africa, Rwanda.
*Corresponding author: Jean Paul Ngarukiyimana: ngabojp@mail.ustc.edu.cn
Cite this article as:
Nkurunziza, I.F., T. Guirong, J.P. Ngarukiyimana and C. Sindikubwabo. 2019. Influence of the Mascarene High on October-December rainfall and their associated atmospheric circulation anomalies over Rwanda. Journal of Environmental & Agricultural Sciences. 20:1-20. [Abstract] [View Full-Text] [Citations]

Copyright © Nkurunziza et al., 2019. This is an open-access article distributed under the terms of the Creative Commons Attribution License, which permits unrestricted use, distribution, and reproduction in any medium provided the original author and source are appropriately cited and credited.
Similar Articles Published in JEAS
- Ali, A. 2021. Assessment of Groundwater Quality using Geographical Information System: A Case Study of Faisalabad, Pakistan. Journal of Environmental & Agricultural Sciences. 23(1&2): 30-35. [View Full-Text]
- Zacharia, M. and T. Li. 2020. Influence of North Atlantic Oscillation on the variation of September – November precipitation variation in East Africa during 1979-2015. Journal of Environmental and Agricultural Sciences. 22(3): 34-47. [View Full-Text][Citations]
- Ali, A., H.U. Farid and M.M.H. Khan. 2020. Divergent effect of rainfall, temperature and surface water bodies on groundwater quality in Haveli Canal Circle of Multan Irrigation Zone, Southern Punjab, Pakistan. Journal of Environmental and Agricultural Sciences. 22(4): 25-36. [Abstract] [View Full-Text]
- Wakachala, F.M., Z.W. Shilenje, J. Nguyo, S. Shaka and W. Apondo. 2015. Statistical Patterns of Rainfall Variability in the Great Rift Valley of Kenya. Journal of Environmental & Agricultural Sciences. 5:17-26. [View Full-Text][Citations]
- Parak et al., 2015. Trends and anomalies in daily climate extremes over Iran during 1961– 2010. Journal of Environmental & Agricultural Sciences. 2:11. [View Full-Text]
1. Introduction
Rainfall variability, especially over East Africa (EA) region, has been a topic of the several studies with different themes subjected to the cause of its interannual variability and was found to be among the complex rainfall system. (IPCC 2007, 2014; Peterson et al., 2013, Nicholson, 1996). Rainfall variability has strong influence on the economy of the region which is based on rain-fed agriculture (IPCC, 2007). Therefore its predictability is an important aspect to be addressed in climate research (Darand et al., 2017).
The equatorial rainfall is mostly controlled by the Inter-Tropical Convergence Zone (ITCZ), the zone of interference of air-masses flowing equator ward from both hemispheres (Hu et al., 2007). The zone ranges over the equator as it oscillates north-south between 15°N and 15°S that lags behind the overhead sun during a period of about 30 days. Forming a welldefined convergence line of winds from the both hemispheres to induce rainfall throughout the year (Alex et al., 2015; Anyah and Semazzi, 2006; Ookola, 1996; Mutemi, 2003; Sagero et al., 2018).
Over Rwanda, the ITCZ moves northward from February to May, and southward from October to December. Dry and cold air masses (Siberian anticyclones) from the Arabian Sea are pushed by winter monsoon over Lake Victoria and yield humidity, which gives a little rainfall in the highlands from December to February (Anyah and Semazzi, 2007; Clark et al., 2003; Ilunga et al., 2004, 2008; Indeje et al., 2000; Kizza et al., 2009; Mutai et al., 1998; Mutai and Ward, 2000). El-Niño/Southern Oscillation is among climate modes that influence also the rainfall over EA with anomalous SSTs (Lyon, 2014; Bowden and Semazzi, 2007; Shreck and Semazzi , 2004, Black et al., 2013) through determining the onset of rainfall and seasonal pattern , wet /dry during El Nino event/La nina events (Mutemi et al., 2003).
Higher rainfall observed in the most parts of East Africa during El Nino year, following a spell of rainfall defici t(Nicholson, 1996)).; later have shown that However during La Nina (El-Nino), the equatorial surface westerlies generally strengthened (weakened) together with zonal pressure gradient, both influenced the East African rainfall during OND season (Hastenrath and Polzin, 2004; Kijazi and Reason, 2004). During Warm ENSO phases, the Lake Victoria region records warmer and more humid conditions, while in neighboring central Tanzania conditions remain warmer and drier (Plisner et al., 2000). The two regions with the most dominant ENSO influences are East Africa (October to December) and Southern Africa (November-February). However, Indian Ocean Dipole potentially drives the climate of East Africa rather than ENSO phenomenon. Contrarily f positive anomalous rainfall during OND reported to be linked with normal ENSO years over Rwanda (Muhire and Ahmed, 2015).
The east Africa rainfall was proved to be driven also by the anomalous SST over the Indian Ocean through the Dipole mode index as per Saji et al. (1999), showing opposite SST pattern over the western equatorial IO to Eastern Equatorial IO vice versa during positive (negative) phases. Thus inducing significant anomalies in the seasonal circulation over the Indian Ocean and the regional climate (Marchantet al. 2006, Deshpande et al., 2014).
A strong connection between IOD and the ElNiño/Southern Oscillation\ENSO) (Ashok et al., 2003, Li et al., 2002; Dommenget et al., 2011) was found, supported by the results of Yuan et al (2008) in their study of IOD Variability, they found also possible connection between the IOD and ENSO phenomena through the “atmospheric bridge”; And to have an influence local and regional climate; some studies have suggested the variability of IOD was governed by Ekman heat transport related to the Mascarene high with ENSO (Annamalai et al, 2005; Tozuka et al. 2007). Where during the positive phase of IOD, Convection shifts to the west and gives rise to an excess rainfall over the E.A (Beheraet al., 1999; Saji and Yamagata, 2003; Yamagata et al., 2004).
The weather of EA is also influenced by the four high-pressure systems i.e Mascarene High, St Helena, Azores and Arabian high, (Ongoma et al., 2016). Mascarene High found to play a leading role in the interaction between both hemispheres through SSTs and Wind anomalies in the Indian Ocean (Huang, 1987, Tang, 1989, Morioka et al., 2015).
Mascarene High induced by Indian subtropical Dipole (IOSD) characterized the behavior of the pressure system of southwest-northeast dipole through SST anomalies (Morioka et al., 2015). Recently Manatsa et al. (2014) showed the variations in the location of the M.H center influences to the variability of the east African rainfall and reviewed by (Ongoma et al., 2016), where they found that the anomalously displaced to the west (east) of Eastern Ridge normal position, the South Easterly trade winds over the SIO were anomalously strengthened (weakened). The shifts of the ridge help in the advection of relatively cooler and less moist low-level airflow over East Africa which turn suppresses (enhances) in both regional convection and orographic rainfall.
East African rainfall regime is bimodal, with two rain seasons, long rains occurring in March-May (MAM) and Short rains of October-December (OND); and separated by two dry spells from June-September (JJAS), January-February (JF) (Camberlin et al., 2009; Owiti and Zhu, 2012; Yang et al., 2015). The climate of Rwanda also display the similar pattern of the bimodal regime (Clark et al., 2003; Ilunga et al., 2004, 2008; Anyah and Semmazi, 2007) rainfall variability over Rwanda showed a low variability (Megan and Robert, 2011). This may be from the location of Rwanda which lies under the Equator, where trade winds shift from the ITCZ are transported between the northern and southern hemispheres anticyclones.
However this study attempts to contribute to the understanding of impacts of the Mascarene highpressure system on the rainfall variability over Rwanda especially during the short rains OND season.
Yet studies (Manatsa et al., 2014, Ongoma et al., 2016) showed the linkages of migration of eastern ridge of M.H to influence East African extreme weather events, such as it was observed that during dry years, MH migration of the ridge to the continent inhibits the influx of moisture from the Indian Ocean to East Africa. Whereas during wet years, MH pressure center shifted to the east (Ocean), moisture from the Indian Ocean freely drawn to the continent. Those studies focused on the entire region of eastern Africa gave the generalized results that may fail to capture the mesoscale contribution to the observed weather events over Rwanda in details. The current study aims to fill that gap. The development of knowledge of the influence of MH to Rwanda’s climate will have an immense application on the forecast of rainfall extreme event over Rwanda which is predominantly generated by the traditional indicators like ENSO and IOD.

Fig. 1. Map showing the location of weather stations (a) and monthly mean rainfall over Rwanda from CRU data(red line) and Station data (dashed black line).
2. Data and Methodology
2.1. Study Area The study
The study area consists of Rwanda territory located beneath equator by 1o4’ and 2o51’ South and 28o53’ and 30o53’ East and it has an area of 26,338 km2 (MINIRENA, 2011) (Fig. 1). The country is located in the west of East Africa and it is known to be called the country of thousand hills, the heart of Africa due to its position near the equator, and hilly topography varying between 1000 and 4507 m rising from low lands in the East to high mountains in the west. (Muhire and Ahmed, 2015; Sirven and Gotanegre, 1974).
2.2. Meteorological Data
Monthly observed rainfall data from 31 different synoptic and agro-meteorological stations in Rwanda obtained from Rwanda Meteorological Agency, Rwanda is used. (Fig. 1 and Table 1). The data covers the period of 34 years i.e from 1981 to 2014, inclusive. Monthly reanalysis rainfall data of 0.5ox0.5o spatial resolution from Climate Research Unit (CRU ) dataset is used (Harris et al., 2014). The same dataset was used by Ongoma et al., (2016) in their studies on spatiotemporal aspects rainfall over the East Africa. Monthly reanalysis temperature, wind, geopotential height, specific humidity from the ERA-Interim are used to determine circulation anomalies are the resolution of 0.5o×0.5o (Dee et al., 2011).
2.3. Empirical Orthogoncal Function
Empirical Orthogonal function (EOF) analysis identifies the structure of spatial distribution by finding a new set of variables that capture most of the observed variance from the data through a linear combination of the original variables (Fig. 2). (Lorenz, 1956). EOF analysis is used in this study to investigate the dominant modes of rainfall variability of October -December over Rwanda. That is to obtain the spatio-temporal structures seasonality from monthly gridded data.


Fig. 2. Spatial mode for (a) EOF1, (b) EOF2, and (c) EOF3 with their time coefficient respectively.
Table 1: Weather Stations of the Study Area with longitude, latitude

The EOF function is defined by the formula of both space and time distributed data as follows:
Eq [1]
Where N is the number of spatial grid po Where N is the number of spatial grid points in the data matrix and e 1 stand for the output vector. By definition, if e1 explains the largest possible fraction of variance in dataset A, then e1 has maximum possible “similarity” to the ensemble vectors of the whole dataset A. The similarity between e1 and the data matrix A at a given timestep t can be quantified as thte projection between the two vectors (as from Eq.1). The equation is squared to remove error, and it should be always positive. Further to prevent the domination of eigenvectors, the data is first normalized (Walsh and Mostek 1980). The standardized rainfall anomaly z is computed as follows:
Eq [2]
Where X is the observed mean rainfall, is the long term mean and Sd is the rainfall standard deviation. The value of z provides immediate information about the significance of a particular deviation from the mean as mentioned by Ogwang et al. (2012).
2.4. Composite Analysis
This method is widely used in atmospheric science analysis for East Africa (Ininda, 1995; Ookala, 1999; Ongoma et al., 2012) and Rwanda (Ntwali et al., 2016; Ngarukiyimana et al., 2016).
In order to understand the Significance of the relationship between the OND rainfall and the circulation anomalies, t-test was done of the occurrence of the rainfall formation with the composite analysis parameters (cited above).
The formula for the t-test is given as equation 3:
Eq [3]
Where X1 and X 2 are the mean samples 1 and 2 and , are sample sizes and are the standard deviation of the sample1 and 2 respectively (Beri, 2005).
In this study, the averages of OND anomalies (wet and dry) were then tested for significance at 95% confidence level.
2.5. Correlation and Regression Analysis
The correlation analysis is performed to establish whether there are some significant relationship between sea surface temperature, geopotential height field, Dipole Mode Index and rainfall. Correlation analysis reveals the simple relationship between two variables.
The simple correlation (rxy) between variables X and Y is expressed by the equation 4:
Eq [4]
Values of the correlation coefficientare always vary between -1 and +1, where the values tending to +1 means that the two variables are stronglyrelated in positive linearwhere the values tending to -1 means that the two variables are strongly related in negative linear.
Simple linear regression analysis aims at finding the relationship between rainfall (dependent variable) and geopotential height (independent variable); regression analysis is showing how the typical the value of rainfall (PC1) changes when any one of geopotential height is varied.
The model of the relationship is applied and estimated the linear relation and established the regression equation.
Eq [5]
Simple linear regression, the sample correlation id the square root of the coefficient of determination, with the sign of the correlation coefficient being the same as the sign of B1, the coefficient of X1 in the estimated regression equation.
2.6. Hovmoller Diagram
Hovmoller diagram was used to show the EastWest shift of East Ridge throughout the study period (1981-2014) in the region of Mascarene High. Thus, we were able to show the migration of the ridges of Mascrane represented by one contour taken to represent the average geopotential height over the region of Mascarene high.


Fig. 3. Monthly mean geopotential heights at 850 hPa. (a) October, (b) November and (c) December. Contour interval is 10 gpm and the contour line of 1530 is in red line.
The results plotted the values of mean geopotential height (contour) at a fixed latitude on one axis (longitude) against time–axis (Hovmoller, 1949).
2.7. Index of the Ridges Ridges of the MH are defined as the average of seasonal mean geopotential height in the region of 30oE-110oE,20oS-10oS; 30oE- 110oE,42oS-35oS; 25oE- 40oE, 12oS-30oS; 90oE- 115oE,12oS-30oS as north, south, west and east respectively and mascarene high center index in 40oE-110oE, 25oS35oS.
3. Results and Discussion
3.1. Rainfall Distribution and Modes over Rwanda
Temporal distribution of rainfall along the year shows a bimodal system of two rainy seasons’ i.e. long rains (MAM) and short rains (OND); two dry spells i.e. JF and JJAS . Many scholars suggesting that the spatial disproportional of rainfall over the country, increasing from Eastern low lands to Western highlands (Ngarukiyimana et al., 2016; Ntwali et al., 2016).
EOFs was used to analyze the variability and dominant modes, the 1st mode showed the highest of the variance of 46.61%, the 2nd mode counted 14.41%, the 3rd counted 10 % of the total variance. The 1st mode was preferred in this study because of its highest variance among others and it reflected a lot the seasonal spatial distribution of the rainfall. Spatial vector showed greater positive loadings South-East region. The loadings decreased towards the north and western region. The first time coefficient series (PC1) presented four years above the threshold (+1), those years were considered as wet years i.e 1982, 1997, 2002, 2006 and six years below the threshold (-1) considered as dry years i.e 1981, 1993, 1996, 1998, 2005.
3.2. Characterization of Mascarene High (MH)
Mascarene Subtropical High greatly influences the climate over the African continent, it was found that the low-level jet at the western edge of the Mascarenes subtropical high transport a large amount of water vapor into Africa (Manatsa et al, 2014). Therefore, the position, shape, and strength of the MH was studied and results are presented below.
It has been noted by (Lu, 2002) and (Hui and Shuqing, 2003) that the contours intervals are not important when one focuses on the shape and wind strengths of a high. While at 200hPa the subtropical high disappeared over the central Indian Ocean and close contours were observed over the western coast of Australia. Moreover, the 850-hPa heights are more familiar and have not shown much difference in the features of the Mascarene Subtropical High as those of 925 hPa. Therefore we preferred to use 850 hPa height to describe Mascarene Subtropical.
Monthly mean Geopotential Height of OND showed an eastward retreat which may be indicated well by the contour of 1530 gpm (Fig. 3) especially the west ridge shifted from continent to the ocean considerably in the east. At the East Ridge, in October, the contour was above around 100oE and shifted eastward slightly in November, and while in December, the contour was approximately near 110oE. It is clear (Fig. 3) that the system was moving eastward from October to December, though monthly contours didn’t depict clearly the shift but interannual anomalies depicted it well. The eastward migration of the Mascarene High ridge from October to December from its normal position weakens the south east trade winds over the South Indian Ocean. This leads to reduction of the relatively cool and dry south east trade winds and induces warm sea surface temperature anomaly in the Ocean. Therefore, convection over the western equatorial of the South Indian Ocean is enhanced leading to rainfall excess over the larger part of study region.
Table 2: Summary of the Correlation Coefficients between Ridge Indices


Fig. 4. Time series of OND anomalies for (a) Sea Level Pressure, (b) Geopotential Height at 850hPa, averaged in the MH region 40o -105oE, 25o -35oS and for (c) MH East Ridge displacement anomalies (based on 1530 gpm contour).
3.3. Mascarene High index and its Ridges
The MH Index is defined as the average of the geopotential height over the region of 40oE-110oE and 25oS-35oS, in this study, the averaged Sea Level Pressure of the period from 1981 to 2014 of OND mean is used to define mascarene high center intensity (Fig 4). But for preferences, OND mean 850hPa geopotential height averaged over the same region was used to define the MH Index as per (Manatsa et al., 2014) and (Hui and SUN Shuqing, 2005) . They defined the index as the geopotential height anomaly averaged in the region of the subtropical high. Although the trend showed the similar tendency and the isolines describing the spatial pressure. Patterns are more robust at 850 hPa level than at sea level pressure.


Fig. 5. Latitude ridge Indices for North and South and Longitude ridge indices for West and East
Further ridges are defined by the averaged anomaly of geopotential height in their regions (Fig. 5). The cross correlations among four ridge indices is shown in Table 2. The correlation coefficient between East Ridge and North Ridge is 0.87, this suggests that the eastward shifts of East Ridge are accompanied with southward shift of North Ridge. This is also seen by the correlation coefficient between West Ridge and North ridge which is 0.67, which implicates that when West Ridge moves to the east, north Ridge follows southward.


Fig. 6. Geopotential Height composite (a) for EP, (b) for WP from the period of 1981-2014. Solid (dashed) contours are OND Hgt (EP and WP).
North Ridge, West Ridge and East Ridge are close related as seen from correlation coefficient (0.87, 0.67, and 0.47) this suggest a strong link between these three ridges and move in coherent manner, thus when the East Ridge tends to move eastward, north ridge falls southward, and west ridge slightly moves to the east.
3.4. The Movement of Ridge Indices
The movement of Mascarene High Ridges show that the North Ridge Latitude was swinging around 14oS during the period 1985-2008 then swaying southward to 21oS and northward again in the later years. While South Ridge Latitude was swinging around 35oS, during 1980-2010, then swaying in the northward to 28oS.
West Ridge Longitude was moving between 32oE40oE during the period of 1981-2000, then after shifted in the east to 60oE. While East Ridge longitude was swaying around 100oE during 1981- 1993, and then abruptly shifted west-east to 110oE in 1997.
The index of East Ridge Longitude Index is used to depict the east-west displacement (its zonal shift). Here reference is made on the contour of 1530 gpm. The years of 1994, 1997, 2006, 2009 as the most displacement to the East (Positive anomalies) while 1995, 2000, 2011 are the most displacement to the West. (Negative anomalies).
Table 3: Years of the anomalous longitudinal position of Mascarene Subtropical High


Fig. 7: Spatial and temporal correlation of ridges indices and PC1 for (a) north ridge, (b) south ridge, (c) west ridge, (d) East ridge, (e) Mascarene High center Index
The inter-annual variability of East Ridge Longitude displays fluctuations tending towards the East-West swinging as indicated in Table 3, The results show that west displacement is more than east displacement, where 10 years presented East Displacement i.e. 1983, 1993, 1994, 1997, 2001, 2002, 2003, 2006, 2009, 2014 and the years of West displacement are 8 years i.e1984, 1985, 1989, 1995, 1996, 2000, 2005, 2011.
It can be seen from the Fig. 6d showing the position of the east ridge based on the contour of 1530 gpm at 850 hPa level fluctuates too much between 1993 to 2001 swings around 104 °E in 1989 and 108 °E in 1997 and then swaying westward the mean position of MH East ridge but below the extreme of East displacement of 1997.
The result of the composite anomaly of ONDmean 850 hPa geopotential height in the region of east ridge (Fig. 6) shows the east-west movement of the Mascarene subtropical high at the east end. During positive anomalies, it shifted in the east whereas, during negative anomalies, the subtropical high withdrew in the west. We defined East Position (EP) and West Position (WP) to describe positive anomalies and negative anomalies respectively through the study.
3.4. Relationship between Rainfall and Mascarene High Indices
Fig. 7 (a, b, c, d and e) shows the results of correlation of the MH Indices with the average seasonal October-December (OND) rainfall over the study area. The temporal correlation of each index with PC1 was calculated. The results show that the highest positive correlation was between PC1 and Eastern Ridge Longitude with a value of 0.55, followed by the correlation between PC1 and North Ridge Latitude with a positive value of 0.34. Whereas correlation with MH Center Index showed relatively positive with a value 0.07, correlation of the west ridge longitude with PC1 also was relatively positive with a value of 0.03. South ridge latitude correlation with PC1 showed slight negative correlation value of -0.02.
Spatial correlation showed similar results with the temporal whereby the spatial correlation between South Ridge latitude and OND mean rainfall showed the value below 0.05 almost above the country except north-west part known to be mountainous with volcanoes channel. But the spatial correlation between OND Rainfall and West Ridge Longitude showed the country to be relative below the value of 0.05.
Spatial Correlation of MH Center Index and OND rainfall showed to be positively correlated with the eastern part increasing in the north of the country with high value in the northern part of volcanoes. Whereas the spatial correlation of north ridge and OND Rainfall shows high value in the south-east of the country, this is confirmed by the greatest spatial correlation of East Ridge and OND rainfall which showed high value in the same region of the SouthEast. For further analysis, how Mascarene subtropical high system influences the rainfall over the study region, and after the correlation results, a detailed study of the East Ridge longitude as it presented to have highest correlation coefficient, on the spatial and temporal scale.
3.5. Longitudinal Position of the East Ridge and Precipitation
The results from correlation map between rainfall and East Ridge longitude showed high correlation coefficients over the study area above 0.45 among all other correlation. Further investigation on how the movement of the subtropical high influences the rainfall over the study area was carried out.

Fig. 8: Composite Anomalies of Rainfall (a) for EP, (b) for WP [solid (dashed) contour for positive (negative) anomalies; contour interval: 5 mm per season].

Fig. 9. Scatterplot of the East Ridge longitude anomaly in (o ) and PC1. Linear Trend, regression coefficient (R2 ) and p-value (p) are respectively at each section.
Table 4: Correspondence of Wet-Dry years and East Ridge Longitudinal Position
The results from composite anomalies of rainfall (Fig. 8) during east position and west position reveal the presence of positive rainfall composite anomalies during the east position. Which indicated that when Mascarene subtropical high weakens and orients itself in the southeast position, has freely let the moisture from Ocean Indian to penetrate the continent. This concur with the previous study by (Manatsa and Behera, 2014).
While negative rainfall composite anomalies were happening during the west position of Mascarene Subtropical High. The results of composite rainfall anomalies agree with the founding of (Manatsa et al., 2016) and (Ogwang et al., 2015b) both studies found the high linkage of the MH to east African rainfall.
Table 3 shows that most of the wet years i.e. 1997, 2002, 2006 all occurred when the Subtropical High is in east position, peaking in 1997 extending eastward the mean position above 10°; On the other hand, the dry years of 1981, 1993, 1996, 1998, 2005 occurred with west position, mainly the most disastrous droughts of 1993 and 2005 coincided with the extreme westward shift of east ridge (Hastenrath and Polzin, 2007).
Table 4 displays the east, west, neutral position years with their corresponding rainfall index from PC1; It can be seen that 30 % of east position occurred in wet years, 10 % of east positions occurred with dry years, while 60% of the east position generally occurred in normal years (Fig.9). The 25% of the west position occurred in dry years whereas 75% of the west position occurred in normal years. Only 6 % of neutral position occurred in wet and dry years respectively (Table 5). Moreover wet years were profoundly linked and occurred in east position and neutral. Whereas dry years mainly occurred in west position and some was occurring in neither west nor neutral position.
3.7. Correlation and Regression Analysis of Longitudinal Position of the East Ridge and Precipitation
The linear relationship of East Longitude Ridge with PC1 is weak and not significant with p value of 0.018, though the eastward shift shows strong linear relationship when moves 2o from the normal position of Mascarene east Ridge the rainfall showed to increase with significant regression coefficient of 0.46 with p value of 0.03 while the westward shift shows very low regression coefficient value of 0.16 and the rainfall decreases.


Fig. 10. Composite Wind anomaly Vector for EP years at (a) 925hPa, (c) 850hPa, (e) 200hPa and for WP years at (b) 925hPa, (d) 850hPa, and (f) 200hPa over Rwanda
3.8. Circulation Anomalies Associated with East-West Position of East Ridge Longitude
3.8.1. Winds
The wind composite anomaly pattern at low level (850 hPa); During EP, the study area was characterized by westerlies (Fig. 10c) while at high level (200hPa); the study area was characterized by easterlies (Fig. 10e). During (WP); at low level (850hPa) the study area was dominated by south easterlies (Fig. 10d). While at high level (200hPa), the study area was dominated by westerlies (Fig. 10f).
The wind pattern at 925 hPa shows westerlies converging with north-easterlies over the study area during east position while during West Position , the study area was dominant by south-easterlies without any convergence. This condition was not favorable for precipitation formation over the study region and can be attributed to the dry events observed during west movement.
Table 5. Correspondence of East Position, Neutral Position and West Position with Rainfall Index (PC1)
3.8.2. Velocity Potential
The anomaly fields of velocity potential/divergence (convergence) associated with a composite of EP and WP are displayed. Fig. 11(a) reveals the lower level for East Position were characterized by convergence, especially over the region. This was accompanied by rising motion thus associated with rainfall formation; south-easterlies from the Indian Ocean converging with westerlies from Atlantic ocean contributed to the formation center in the region of 10°S-10°N, and 20°E-50°E. While forWest Position (Fig. 11b) were characterized by divergence were observed over the same region.


Fig. 11. Composite Velocity Potential and convergent (divergent) wind at 850hPa (a) EP years and (b) WP years; and at 200 hPa (c) EP years and (d) WP years.
Fig. 11c reveals the upper level for East position were characterized by divergence, over the region of 10°S-10°N, and 20°E-50°E experienced three centers of divergence among which over the western Indian ocean and east African. While for 11(d) West position were characterised by convergence over the same region encountered centers.


Fig.12. OND SST composite anomalies for (a) E.P observed Years, (b) W.P observed Years and correlation between OND SST with (c) Mascarene High center Index, (d) Mascarene East Ridge; (solid (dashed) contour are positive (negative) correlation coefficients, shaded area are significant at 95%).
3.9. Sea Surface Temperature Analysis
Sea surface temperature is known for being the source of rain formation moisture through evaporation, thus being a key point to influence the rain. Its variability is linked d to rainfall variability. Studies showed that the decline in rainfall in East Africa is attributed SST perturbation over the Pacific Ocean (Yang et al., 2015; Ogallo, 1989; Black et al., 2003), Atlantic Ocean, and Indian Ocean known as El-Nino Southern Oscillation (ENSO), North Atlantic Oscillation, Indian Ocean Dipole respectively (Saji, et al., 1999; Owiti, et al., 2008).
Fig. 12a displays the composite anomaly of SST during east position of the East Ridge longitude, it reveals positive anomalies especially in the region of equatorial west indian ocean and this may imply a major link between the eastward shift of Mascarene East Ridge and positive SST anomalies. Whereas Figure 12b displays the composite anomaly of SST during west position of the East Ridge, results show negative anomalies in the same region.
The results from composite anomaly of SST during east position of the Mascarene East Ridge and SST during west position of the Mascarene East Ridge are in agreement by Morioka et al. (2012) showing the northeast-southwest oriented SST dipole with the Mascarene High being strengthened in the northernmost part of the Southern Indian Ocean; and recently (Morioka et al., 2015) showed that amplitude, location, and shape of the SST anomaly poles are strongly linked with those of the SLP anomalies, suggesting that a better representation of the SLP anomalies may be required to simulate the SST anomalies associated with the IOSD.
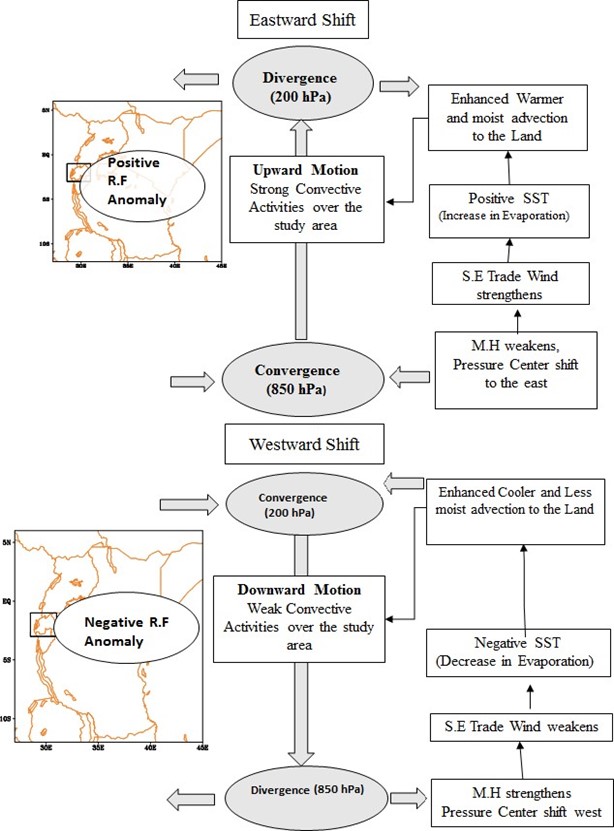
Fig. 13. Mechanism of the influence of Zonal Shift of East Ridge event on OND Rainfall
Fig.12 c, d displays the correlation between SST and Mascarene High center Index and East Ridge Longitude. the correlation between SST and East Ridge Longitude show positive correlation coefficient in the western equatorial Indian Ocean with significance (shaded area are significant above 0.05 level). This shows that when the east ridge shifts eastward, SST rises over the western equatorial Indian Ocean. Whereas the correlation between SST and Mascarene High center index showed negative correlation coefficient in the western equatorial Indian Ocean (Fig.13).
4. Conclusion
This study aimed at investigatingthe influence of Mascarene subtropical high and the associated circulation anomalies on Rwanda’s precipitation since 1981-2014 during the short rains season from October to December (OND). The relationship between Mascarene high indices and rainfall over the study area was revealed, only the East Ridge index presented significant result (r=0.53) and show that when MH moves eastward from its normal position, the rainfall was abnormally increased while when MH moves westward from its normal position the rainfall was abnormally decreased. Associated anomalies of atmospheric circulation (wind, velocity potential, sea surface temperature) show a close relation with the zonal movement of the eastern ridge. Wind anomaly patterns present southerlies and easterlies from the Indian Ocean entering the continent during eastward position at a lower level (850hpa). As the Mascarene High weakened; the southerlies advected moisture from western equatorial Indian Ocean and reached Rwanda after deflected by mountain Kenya and Kilimanjaro as north easterlies and easterlies converging with westerlies from Congo airmass. While on the other hand during the westward position, presented the reverse. Wind surface (925hPa) showed to be easterlies dominant than northeasterlies during east position while during west position presented northwesterlies wind were obeserved without any convergence. Further investigation reveals that when the East Ridge is in the East Position, the SST is warm than normal (positive anomaly) and cooler (negative anomaly) during West position.
List of Abbreviations: CRU, Climate Research Unit; EA, East Africa; ENSO, El-Niño/Southern Oscillation; EOF, Epmirical Orthogonal Function; EP, East Position; IOSD, Indian subtropical Dipole; ITCZ, Inter-Tropical Convergence Zone; JF, Januray-February; JJAS, June-July-AusgustSeptemberEl-Nino Southern Oscillation (ENSO); MAM, March, April, May; MH, Mascarene High; OND, October-November-December; SST, sea surface temperature; WP, West Position.
Competing Interest Statement: The authors declare that there is no potential conflict of interest whatsoever.
Author’s Contribution: IFN, JPN, CS and TG initiated the idea of the research, performed analysis and wrote the whole manuscript; TG supervised the research. All authors have discussed the results and revised manuscript.
Acknowledgments: The authors would like to express their appreciation to University of Science and Technology of China (USTC) for creating a research enabling environment. The work described in this paper is supported by National Science and Technology Support Program of China (2015BAC03B02), National Natural Science Foundation of China (41575070, 41475090). Special appreciation goes to Rwanda meteorology agency (RMA) and Climate Research Unit.
References