
Journal of Environmental and Agricultural Sciences (JEAS). Zacharia and Li, 2020. Volume 22(3): 34-47
Open Access – Research Article
Influence of North Atlantic Oscillation on the Variation of September – November Precipitation Variation in East Africa during 1979-2015
Mwai Zacharia1,2,* , Tao Li1
1 School of Atmospheric Science, Nanjing University of Information Science & Technology, Nanjing, China
2 Kenya Meteorological Department, P.O. Box 30259-000100, Nairobi, Kenya
Abstract: This study was designed to investigate East African rainfall variation and the North Atlantic Oscillation effects. Studied region, East Africa, comprised Burundi, Kenya, Rwanda Tanzania and Uganda. The analysis was primarily based on the construction of empirical orthogonal functions (EOFs) on data collected from Climate Prediction Center (CPC) Merged Analysis of Precipitation (CMAP), where the first leading model was retained for the period 1979–2015 during the September – November (SON) season. The EOF analysis was augmented by the projection of National Centers for Environmental Prediction (NCEP) Reanalysis wind data, monthly mean geopotential height, and vertical velocity (Omega) onto the first EOF mode timeseries to understand the rainfall–circulation relationships. Moreover, composite and correlation analyses were performed with the HadISST (Hadley Centre Sea Ice and Sea Surface Temperature) data set. Anomalies and specific SST signals connected to the short rains especially the North Atlantic SSTs, were evaluated, delineated and monitored,. It has been found out that the significant influence is the Rossby wave movement depicted by the alternating Anticyclonic and cyclonic movements’ from the North Atlantic to Equatorial East Africa, clearly seen in the regression field of the zonal and meridional wind streamlines and the EOF 1 time-series.
Keywords: North Atlantic Oscillation, Rossby waves, Variability, EOF.
*Corresponding author: Mwai Zackaria, mwazack@gmail.com
Cite this article as:
Zacharia, M. and T. Li. 2020. Influence of North Atlantic Oscillation on the variation of September – November precipitation variation in East Africa during 1979-2015. Journal of Environmental and Agricultural Sciences. 22(3): 34-47. View Full-Text Citations

Copyright © Zachariya and Li, 2020. This is an open-access article distributed under the terms of the Creative Commons Attribution License, which permits unrestricted use, distribution, and reproduction in any medium provided the original author and source are appropriately cited and credited.
Similar Articles Published in JEAS
- Ali, A., H.U. Farid and M.M.H. Khan. 2020. Divergent effect of rainfall, temperature and surface water bodies on groundwater quality in Haveli Canal Circle of Multan Irrigation Zone, Southern Punjab, Pakistan. Journal of Environmental and Agricultural Sciences. 22(4): 25-36. [Abstract] [View Full-Text]
- Ghafoor, A. and R. Nawaz. 2020. Changes in climatic parameters in metropolitan city of Lahore, Pakistan. Journal of Environmental and Agricultural Sciences. 22(3): 23-33. [Abstract] [View Full-Text]
- Wakachala, F.M., Z.W. Shilenje, J. Nguyo, S. Shaka and W. Apondo. 2015. Statistical Patterns of Rainfall Variability in the Great Rift Valley of Kenya. Journal of Environmental & Agricultural Sciences. 5:17-26. [View Full-Text]
- Parak et al., 2015. Trends and anomalies in daily climate extremes over Iran during 1961– 2010. Journal of Environmental & Agricultural Sciences. 2:11. [View Full-Text]
1. Introduction
Extreme weather events, depending upon their duration, intensity and frequency, caused devastation of economical societal assets, and contributing to fatalities and destruction of essential infrastructure, agriculture and economy (Darand et al., 2017; Olayide and Alabi, 2018; Sutanto et al., 2020). Interannual weather variability is significantly triggered by large-scale air-sea interactions (Sein et al., 2015; Wakachala et al., 2015). Recently, increased number of droughts, heatwaves and floods affected lives of millions across the globe (Raikes, et al., 2019; Yang and Liu, 2020), especially inhabitants of arid and semi-arid areas (Seregina et al., 2020). A better understanding of variability in rainfall trends will be helpful for climate resilience and socio-economic sustainability (Omondi et al., 2014).
East Africa (15◦S to 15◦N and 24◦ to 54◦E), has its annual hydrological cycle, driven by the sun’s movement and associated changes in surface and atmospheric heat fluxes (Abera et al., 2020; Haile et al., 2019). The East African climate is controlled by planetary-scale features, such as the southern overturning of the Inter-Tropical Convergence Zone (ITCZ) and Hadley Circulation, and their teleconnections with sea-surface temperature (SST), and pressure features (ElNino Southern Oscillation (ENSO), Indian Ocean Dipole (IOD)) and also the influence of the Indian Ocean monsoons (Camberlin, 2018; Cattani et al., 2018; Haile et al., 2020; Park et al., 2020).
Generally diverse climatic conditions prevail in East Africa, mainly because of the complexity of large-scale controls (lakes, seasonal dynamics of the tropical circulation, topography and maritime influence. Rainfall significantly vary in amount, distribution and seasonal pattern, even at short distances (Nicholson, 2017; Ongoma et al., 2018). Furthermore, Turkana Low-Level Jet (LLJ), created by highland ranges, also have a substantial effect on precipitation pattern (Kinuthia and Asnani, 1982; Munday et al., 2020). It affects the surrounding area’s rainfall characteristics by alerting temperature, moisture, and vertical velocity fields, therefore, regulating circulations at mesoscale (Nicholson, 2016).

Fig. 1. Map of East Africa
East African annual rainfall cycle is characterized by bimodal (two peaks) and unimodal (one peak) pattern (Abera et al., 2018; van der Plas et al., 2019). The bimodal pattern contains March-May (MAM) rains (long rains) and October-December (OND) (short rains). ITCZ movement, (migrates between 15◦S and 15◦N from January toJuly), and monsoon circulation significantly influence annual rainfall cycle (Nicholson, 2018). In countries, like Kenya, ITCZ’s monsoonal winds are the primary moisture flux source (Cook and Vizy. 2019; Ogallo, 1988). Whereas, trimodal rainfall pattern prevails in regions of eastern Rift Valley and Lake Victoria Basin, with an additional (third rainfall peak) peak during June– August (JJA) (Wakachala et al., 2015). Third rainfall peak can be attributed to the moist westerly air stream influx from the Atlantic Ocean and Congo Basin (Nyakwada et al., 2009; Ogallo, 1988). Conversely, southern Tanzania experiences a merged rainy season (unimodal pattern), connected with the summer rainfall pattern of southern hemisphere (Anyah and Qiu, 2012). Short rainy season may start earlier, as in case of Uganda, a month earlier, extended from September to October (Nsubuga et al., 2014).

Fig. 2. East African rainfall annual time-series
High spatial inconsistency in the seasonal rainfall distribution can be credited to the diverse topography of East Africa (Fig. 2). Higher interannual variability can be observed in the OND rainfall in contrast to the MAM (long rains) (Black et al., 2005; Ayugi et al., 2020).
Intense and prolonged precipitation events, but with a lesser extent of interannual variability, are generally observed in the long rains (Nicholson, 2017), with limited interannual variability, and are apparently linked with local factors. Contrarily, short rains (SON) precipitation events are shorter and mild, and higher variability at interannual and intraseasonal scales (Camberlin, and Philippon, 2002) that reflects larger phenomena (ENSO) and the fluctuating strength of the zonal circulation towards the equatorial Indian Ocean (Chan et al., 2008). The Long Rains (MAM) have a greater contribution (>70%) to the annual rainfall as compared to the short rains (<20%). With a coefficient of variability at 35% compared with 74% for the short rains (WWF, 2006), which provide the maximum rainfall in some parts of Kenya (Nicholson, 2015).
Interannual rainfall variability of East African and its interrelation to SSTs (using statistical models) have been intensively reported (Appelhans and Thomas, 2016; Ongoma et al., 2018; Ongoma et al., 2019) and observational data sets, highlighting the importance of Indian and Pacific Oceans in regulating rainfall variability (Black et al., 2005). The studies present a. They have shown that different factors influence the variability of rainfall over east Africa. These are characterized by either ElNino Southern Oscillation events (an integrated ocean-atmosphere phenomenon principally happening within the tropical Pacific Ocean, however, have consequences and effects in other parts of the earth through atmospheric teleconnections) or SST anomalies gradient from east to the western portions of the Indian Ocean, (IOD) (Ndomeni et al., 2018; Ratna et al., 2020).
Indian Ocean significantly influences regional hydrometeorology including East Africa (Black et al., 2005, Saji et al., 1999) when compared to other oceans. However, limited reports have focused on the influence of the Atlantic Ocean. Over East Africa, most of the earlier studies focused on OND variability since it has been shown to exhibit more interannual variability than the MAM season (Kerandi et al., 2017; Ongoma et al., 2019).
Quasi sea-saw east-west SST gradient explained Indian Ocean Zonal Mode (IOZM), and reversal across the Indian Ocean (Saji et al., 1999). Mascarene High (MH)’s influence revealed that the variability of short rains in East African, with a strong link with the MH zonal movement, especially the eastern ridge. Other parameters (slope, mean elevation) affecting the variability (Oettli and Camberlin, 2005). Mean elevation apparently has an insignificant effect on the amount of rainfall, rather regulates the rainfall frequency (Camberlin et al., 2014). The zonal wind firmly controls both intraseasonal and interannual variability over Indian Ocean and equatorial East Africa (Camberlin, 2018), across the seasons, except boreal summer. Moreover, zonal wind shear is strongly linked with ENSO, as compared to the IOZM (all seasons except boreal summer).
Interannual linkage between the boreal winter Arctic Oscillation (AO) and East African early short rains are reported earlier (Gong et al., 2016). When the IOD and ENSO variance were excluded by linear regression, the boreal winter AO index was significantly correlated with the October East African precipitation. The upper-ocean heat content likely acts as a medium that links the AO and East African precipitation.
A strong interannual interrelationship between early short rains (of East Africa) and boreal winter Arctic Oscillation was observed, which triggers anomalous wind stress curl (in the tropical Indian Ocean) and produces oceanic Rossby waves (Gong et al., 2016; Souverijns et al., 2016). The downwelling Rossby waves lead to irregular upper-ocean heat content, increasing precipitation over East Africa (in October) (Chen at al., 2019). This study was designed to investigate the effect of the North Atlantic Oscillation on precipitation anomalies in East Africa during the SON season.
A strong interannual interrelationship between early short rains (of East Africa) and boreal winter Arctic Oscillation was observed, which triggers anomalous wind stress curl (in the tropical Indian Ocean) and produces oceanic Rossby waves (Gong et al., 2016; Souverijns et al., 2016). The downwelling Rossby waves lead to irregular upper-ocean heat content, increasing precipitation over East Africa (in October) (Chen at al., 2019). This study was designed to investigate the effect of the North Atlantic Oscillation on precipitation anomalies in East Africa during the SON season.
2. Data and Methodology
2.1. Study Area and Data Sources
The principal analysis of eastern African rainfall variability is based on CPC Merged Analysis of Precipitation (CMAP) data (Xie and Arkin, 1996), derived from a combination of satellite estimates and gauge observations. Seasonal averages of the data set (SON) for 37 years (1979 to 2015) (2.5° × 2.5° horizontal resolution) were utilized. While the Hadley Centre Sea Ice and Sea Surface Temperature data set (HadISST) containing satellite-derived estimates at the sea surface observations (Rayner et al., 2003) to form a comprehensive SST observation dataset. This data set gives global, reanalysis 1.0◦ × 1.0◦ gridded, sea-surface temperature (SST) data from 1870 to 2015.
Past weather data was reanalyzed, to get a clear depiction of weather conditions in the past, independent of the diversified instruments used across the years. Various methods were used for integration of observations and instruments to get unfiformly spaced grid of data, comparing the recorded observations with other gridded datasets.
We adopted the National Center for Environmental Prediction (NCEP) reanalysis of wind data, Vertical velocity (Omega), and Monthly mean geopotential height to examine rainfall–circulation relations linked with the dominant EOF mode of East African rainfall for the SON season (1979 – 2015).
2.2 The Empirical Orthogonal Function (EOF) analysis
The primary method of investigation, EOF method, compute the eigenmodes and get correlation matrix based on the normalized rainfall anomalies at seasonal scales. It is considered among the most efficient methods of compressing spatiotemporal geophysical data and noise separation, from target data. The technique used to get a new set of variables that cover the larger segment of the observed variance by means of linear combinations of the original variables.
The EOF technique explains the variance-covariance of the data usung a few variability modes (eigenvectors and principal components), accounting for the most significant percentage of the original inconsistency are retained after performing the traditional statistical tests (Peixoto and Oort, 1992).

Fig. 3. East African Rainfall Climatology For (a) September (b) October (c) November and (d) SON season (1979-2015).
Several studies have used the EOF technique to investigate the climate of east Africa. Very few reports applied the EOF method to identify the homogeneous climate variability regions for east Africa (Ogallo 1989). Most of these studies focused on IOD and ENSO, while (Indeje et al. 2000) performed EOF analysis on the East African short rains, aiming mainly on the ENSO signal, which accounted for the largest variance in the study, with less or no focus on North Atlantic Oscillation.
EOF analysis of the September – November 1979 – 2015 precipitation anomalies were performed (over a domain enclosed by 24°E 54° E and 15°S 15°N) to determine the principal modes of variability over East Africa, during the SON season. The resulting first four EOFs i.e. EOF 1 (38.97 %), EOF 2 (11.81%), EOF 3 (7.95%), and EOF 4 (5.54%) exhibited decreasing total variance (Fig. 4).

Fig. 4. EOF modes in Percentage
2.3. Correlation analysis
The correlation analysis quantifies the relationships between rainfall EOF 1 and SST anomalies over the global oceans. Student t-test was used to determine the significance of the values of correlation. The correlation coefficient between the two variables (rainfall and SST) is defined as follow:
 [Eq 1]
2.4 Composite Analysis
The composite analysis was performed to detect and average categories of fields of a variable selected considering their linkage with critical conditions. Subsequently, hypothesis was made using composite’s results to identify the patterns likely to be associated with individual scenarios (Folland,1983). The student T-test technique was used to asses the correlation coefficient significance between the two variables.
3. Results
3.1. The Empirical Orthogonal Function (EOF) analysis
The EOF analysis of the seasonal (SON) precipitation anomalies from 1979 to 2015 was performed to determine the main systems of rainfall variability over East Africa. The EOF analysis showed a decreasing trend in total variance, highest for the EOF 1 (38.97 %), followed by EOF 2 (11.81%), EOF 3 (7.95%), while the lowest for EOF 4 (5.54%) (Fig. 4)
Modal space vector field of precipitation in East Africa is characterized by positive values of the total vector field, with maximum variance over Kenya’s Eastern and coastal parts (Fig. 5 (a)). Contrarily, the minimum values are located in southern Tanzania and parts of Burundi. The leading EOF explains 38.97% of the total variance, indicating that the first eigenvector field is the main contributing pattern of seasonal precipitation variation from September to November.
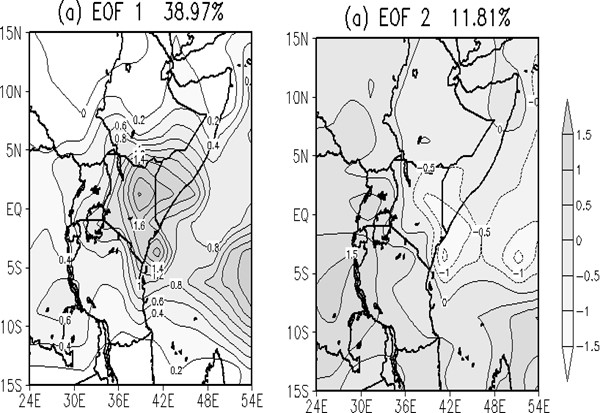
Fig. 5. The spatial patterns of the EOF modes for the Sept – Nov seasonal rainfall anomalies: (a) First EOF mode and (b) Second EOF mode (1979-2015).
Fig. 5 (b) is the second modal space vector field of precipitation in East Africa. The loadings are both positive and negative, indicating a kind of north/south dipole mode. Kenya’s characteristic values are gradually increasing from southeast to West and northwest deep into Uganda, Rwanda, and Burundi having higher values. Observed pattern highlighted negative rainfall anomalies across the northern regions of East Africa, however, positive rainfall anomalies recorded across the southern areas, thus changing in a reverse direction. Since only 11.81% of the total variance, we choose the first mode for the analysis.

Fig. 6. Time-series of the first principal component of East African rainfall during September – November (1979-2015).
Precipitation anomalies indicated that the years with normalized rainfall departures (>+2.0112, which is 0.5 of the standard deviation), were categorized as wet rainfall events, whereas dry rainfall events includes the years with rainfall anomalies < −2.0012 of the standard deviations. The temporal characteristics of the modes observed (Fig. 6) indicated that they represented interannual and annual variability, showing a negative trend from 1979 to 1985, then from 1986 to 1990 changed to a positive trend. After 1991, the precipitation in East Africa continued to fluctuate between the positive and negative years annually.

Fig. 7. (a) Average SST correlation in September (b) Average SST correlation in October (c) Average SST correlation in November (d) Sept – Nov Average SST correlation field.
3.2. Correlation analysis
Considering on the correlation analysis of the first EOF mode time-series and the global sea surface temperature. The sea area with the most significant influence on precipitation in East Africa is used in this study. The most significant impact was found in the Atlantic and Indian Oceans; from 30 ° S of the Atlantic Ocean, the correlation is negative (Fig. 7 (a)). The largest negative center is located near Porto Alegre. Most of the Indian Ocean is positively correlated, with the largest positive center at 30 ° S, and most of the Indian Ocean south of 30 ° S are negatively correlated. The correlation between the Pacific Ocean is both positive and negative, with a large negative correlation area (in the Eastern Pacific Ocean), and the positive correlation (western pacific).
October correlation shows that the North Atlantic correlation is high with a coefficient of 0.4, at 30 ° N to 60 ° N there is a positive and negative correlation center (Fig. 7 (b)). The maximum positive value is located at 45 ° N, the negative center is located near 30 ° N, and the correlation coefficient of the Atlantic Ocean in the equator is also high at 0.3. In South Atlantic, the negative correlation decreases, thus the correlation between the Atlantic Ocean and the East African first EOF mode improves.
The Indian Ocean correlation decreases compared to September but remained correlated mainly with the largest negative center at the tip of South Africa. The magnitude of the Pacific Ocean is larger than that in September, and the positive Center is also enhanced at the Western pacific with a positive correlation (0.3 correlation), with the Eastern Pacific being negatively correlated.
In Fig.7 (c), the NAO’s November correlation coefficient is consistent with that of October, and it is still a positive and negative distribution. The equatorial Atlantic Ocean’s positive correlation range is reduced, and the maximum positive center is also reduced. The positive range of the Indian Ocean is more pronounced in the North Indian Ocean, and the negative persist at the tip of South Africa. In contrast, while the positive center increases in the Eastern Indian Ocean near Australia with a coefficient of 0.3. The positive correlation in the pacific remains on the western Pacific and the negative on the eastern Pacific, though the correlation coefficient is reduced.
Fig. 7 (d) shows the correlation between the mean sea surface temperature and EOF 1. It can be seen that there is a positive and negative center in the North Atlantic, both being significant, which has been seen in the individual months of October and November respectively compared with other areas of stability. The Equatorial Atlantic Ocean also depicts a significant correlation over the SON season and the North Indian Ocean, though not as significant as the Atlantic Ocean.
3.3. Composite Analysis
In this study, positive and negative years were identified as the years of maximum values exceeding a standard deviation of +2.0112, which includes; 1987, 1988, 1989, 1990, 1995, 2000, 2003, 2008, 2012 and 2013, and years below standard deviation of -2.0112 which includes; 1979, 1980, 1982, 1983, 1985, 1993, 1996, 2005, and 2009.

Fig. 8. SST Composites during Positive and Negative years where areas with contours are the significant regions as a result of statistical t-test with over 95% level of confidence, for Sept- Nov (1979-2015) (a), wet events (b), dry events.
The critical conditions for the spatiotemporal rainfall distribution and the linked circulation anomalies over East Africa composite analysis are dry and wet, where the composites for dry and wet years were distinctly performed, especially for SST (Fig. 8), mainly to identify the circulation anomalies linked with dry and wet events. The North Atlantic and Equatorial Atlantic show a high significance for the positive and the negative years, while the North Indian Ocean and western Pacific show some significance though not as strong as the Atlantic Ocean.

Fig. 9. The regression of 850 hPa and 200 hPa meridional and zonal wind with respect to EOF 1 time-series during SON season 1979-2015.
3.4. Circulation under the influence of North Atlantic SST anomalies
This part mainly explains how the circulation over the North Atlantic influences the precipitation of East Africa from the circulation background field, and the main factors, affecting the precipitation, are the water vapor condition and vertical motion as well as the Rossby waves.
Fig. 9 (a) (b) displays composite maps of the 850- hPa and 200hPa meridional and zonal wind anomalies throughout the oscillation cycle, represented by EOF1. A wave-train structure extending from Ethiopia to the North Atlantic Ocean, visible in both maps. Ridges and troughs of the wave train are meridionally elongated, however, their axes are tilted (northeastsouthwest), potentially attributed to the quasistationary Rossby wave response. The systematic Southeastward propagation is also evident.
There was a strong anticyclone over the North Atlantic. The formation of Rossby circulation anomaly wave spread to the southeast, at 200 W, then formed a robust cyclone near 400 N in the coast of Spain and Morocco, the cyclone spreads to North Africa, then the wave continues southeastwards, forming a strong anticyclonic center in northern Libya and Chad area.
Due to the effect of Northeast trade winds (from the Arabian high), forced the wave further to the southeast, the cyclone center generates a weak intensity over Ethiopia, where there is a convergence of the south and north easterlies from the Indian Ocean. The anomalous easterly flow control rainfall over Kenya and other East African regions. This is visible in the 850hPa, where the region is mainly affected by the North Atlantic Oscillation’s Rossby wave movement patterns.
The outflow at the uppermost of the tropopause produces an anomalous divergence, leading to the generation of anomalous Rossby waves, that propagates away from the source region (Schlueter, 2020) that is the North Atlantic where we have a strong Anticyclone as well as a Cyclonic movement which alternates up to the equatorial region of East Africa, then move towards Asian continent. To the south of the Equator, there is a cyclonic Center over the southeast of Madagascar Island. The East African area is located in the front of the anticyclone. It is affected by the easterly wind and significantly influences the precipitation pattern in East Africa during the SON period (Camberlin, 2018; Zhao et al., 2019).
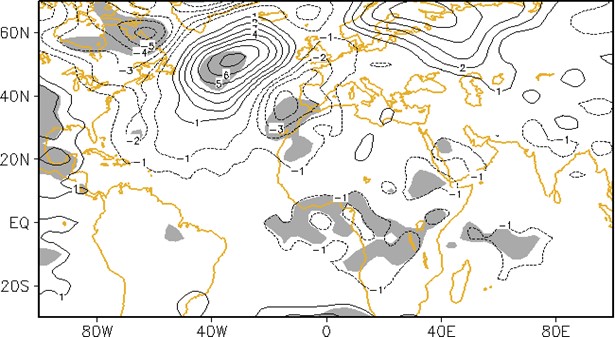
Fig. 10. Regression pattern between the first EOF mode time-series in East Africa and the Mean geopotential height field, during Sept – Nov Season 1979-2015.
Fig. 10 shows regression between the first EOF mode time-series and the mean geopotential height at 1000 hPa anomalies for September – November 1979 to 2015. There is a low-pressure center in Kenya, Ethiopia, and the Western Indian Ocean depicting negative anomalies of geopotential height.
Similar negative anomalies were also significant in Rwanda, Burundi, and parts of Tanzania near Lake Victoria, extending from the Congo Basin to the Equatorial Atlantic Ocean. This tends to have a significant influence on East African rainfall during this season as these are areas of low-level convergence. Moreover, a significant, but low-value center in the northwest of Morocco was detected. As the geopotential height increases, the isobars becomes denser, depicting a high-value center around 40oW in the North Atlantic Ocean. The anomalous low-value Center shows the weather pattern of two troughs and ridges near the North Atlantic. The Indian ocean at 40o E to 80o E has a low-value center (Fig. 8 (b)), such similarity in the area indicates an intense anticyclone center in the upper levels, thus acts as divergence aloft and convergence below influencing rainfall over the East African coast.
The abovementioned pattern highlighted that the Ocean area where the air pressure is high has anomalous SST, indicating that the atmosphere is forcing the ocean and that the sea temperature anomaly occurs due to the strong high-pressure center over the North Atlantic Ocean (Fig. 9).

Fig. 11. Regression patterns of Mean 500hPa Vertical velocity (omega) with the EOF 1 time-series for SON season 1979 – 2015.
Fig. 11 is the Regression pattern of the mean 500hPa vertical velocity against the first EOF timeseries analysis. Due to the strong anticyclonic center in the North Atlantic Ocean, the SST anomalies increased, which appeared in the strong sinking motion. The region around 20o W, 50o N represents the most robust sinking motion in the Atlantic Ocean, and the 200hPa wind field the Rossby wave through the area has strong ascending and descending motion (Fig. 9, (b)). At 15o W, there is a strong upward motion, which is also shown in the wind fields at 30o N by the strong cyclone center. The Equatorial Atlantic Ocean shows a rising motion.
In the north Indian Ocean, there is an anomalous ascending motion and passed the test of significance. This upward movement is likely to impact the East African SON season precipitation, combined with the wind field, and these rising and sinking motions are clearly defined.
4. Discussion
The variation of the SON rainfall over the East African region has been investigated, in conjunction with the North Atlantic Oscillation’s influence. Most of the studies mentioned earlier used OND as their short rainy season (Broman et al., 2020; Camberlin, 2009; MacLeod, 2018; Manatsa et al., 2014), while in this study, the SON was used as it showed a higher correlation with North Atlantic SSTs than when December is included in the study period.
The analysis of EOF indicated that the SON rainfall variation is more pronounced in Kenya, which shows the highest rate of variation (38.97 % of the variance) (Fig. 5 (a)). The second mode comprises both negative and positive values, indicating a north/south dipole mode with high negative values along the Kenya coast and the Indian Ocean at -1.5 variance while in Western Kenya and all the rest of East African Countries have Positive values. Considering standard deviation (0.5) of the first EOF time-series to represent the negative and positive years from +2.0112 and -2.0112 resulted in ten anomalous positive years and nine anomalous negative years.
Initially, the magnitude of large-scale SST forecasters, associated with the averaged rainfall across East Africa, was assessed. Most of the areas were well correlated, although sparse patches of lower correlations suggested that large-scale ENSO (and other coupled ocean-atmosphere signals) at region scale can be attributed to the association with orographic features. The first EOF time-series was correlated with the Global SSTs on seasonal and monthly basis during the SON and represented significant correlations with the Equatorial Atlantic, North Atlantic Ocean, and some parts of the North Indian Ocean, South Atlantic, and Western Pacific, however, most of the Eastern Pacific was negatively correlated.
The SST composite for positive and negative years (Fig. 8) highlighting the significant (95% confidence level) correlation in the north Atlantic Ocean around 50oN and 60oW. The Regression analysis othe circulation fields that affected the east African rainfall pattern. A barotropic atmosphere was detected with a wave train structure extending from the equator to the North Atlantic Ocean, with alternating Anticyclones and cyclones (Fig. 9 (a), (b)). This pattern can be attributed to the quasi-stationary Rossby wave train emanating from North Atlantic and propagates southeastward and reaches the Asian subtropical jet stream , potentially the primary mechanism regulating East Africa’s autumn rainfall. Thus a barotropic positive anomaly observed in the north in response to a warmer SST anomaly, via airsea interaction, over the northeast Atlantic Ocean.
Against the mean geopotential height, the regression field shows that there is a negative correlation in the western Indian Ocean in addition to the Equatorial Atlantic Ocean through Central Africa to East Africa and also around Ethiopia, and similarly along the Moroccan coast, which is associated with low-level convergence leading to rising motion and hence the association with wet regions (Camberlin, 2018). Contrarily, an upper-level divergence (Fig. 9 (a) and (b)) implies that higher than normal pressure leads to sinking motion attributed to drying, but in the North Atlantic Ocean, it is significant (95% confidence level) and positively correlated.
Between the vertical velocity (Omega) at 500 hPa and the EOF1 time-series, the pattern shows the strong sinking motion in the north Atlantic and the Mediterranean area while rising motion off the Moroccan coast and equatorial West Indian Ocean due to diabatic heating. Robust Middle East jet stream was observed, mainly in the exit section of the jet core, thus enhancing the anomalous anticyclone (the upper troposphere). The enhanced meridional acceleration yields irregular convergence south of the jet core in the upper levels, which are conducive for abnormal sinking motion and building pressure in the lower atmosphere.
Weak correlation (with high spatial variability) between NAOI (North Atlantic Ocean Oscillation Index) and OND rainfall over Kenya was found, and it varied from from negative to positive association. However, a minimal area in the western part of Kenya exhibits a significant relationship between NAOI and OND rainfall (Shilenje et al., 2015). The middle east jet stream, in association with the positive NAO phase are vital to enhance the Arabian high, causing the north easterlies towards the equator and strengthens the ITCZ, and results in more than usual precipitation in East Africa.
5. Conclusion
The East African rainfall and global SSTs and other circulation variables based on the CMAP, HadISST, and NCEP/NCAR Reanalysis observational datasets, show an apparent rainfall anomaly with North Atlantic effects. Driven primarily by the Rossby wave through the alternating anticyclones and cyclones from North Atlantic to Equatorial east Africa. The negative(dry) and positive (wet) years of the EOF1 time-series demonstrate more than an annual variation, with the highest negative anomaly occurring from 1979 to around 1985, then a positive change from 1986 to 1990. Air masses, from the Atlantic ocean, are advected into central Africa adjacent to the northern margins of the climatological heat low across the southwest Africa. These air masses are lifted over the East African highlands and encounter the easterly flows from the Indian Ocean in a meridional convergence zone.
This system for enhanced rainfall is relied on the convergence of fluxes (low-level) into East Africa, resulting in the unstable lower atmosphere, subsequently producing rainfall. Conversely, some occurrences of moist Atlantic westerlies have been linked with rainfall deficits over eastern parts of Kenya. Prevalence of upper level (200 hPa) easterly anomalies indicated a zonal circulation cell across East Africa and western Indian Ocean. The increased westerly emerged from the Congo Basin joined with the robust easterlies across the western Indian Ocean develops low-level convergence. Further research is required to formulate indexes to assist in forecast and predicting precipitation during the SON season and validate research findings through models.
Abbreviation: AO, Arctic Oscillation; CMAP, CPC Merged Analysis of Precipitation; EASR, East African Short Rains; ENSO, ElNino-Southern Oscillation; HadISST, Hadley Centre Sea Ice and Sea Surface Temperature data set; IOD, Indian Ocean Dipole; IOZM, Indian Ocean Zonal Mode; ITCZ, Inter-Tropical Convergence Zone; JJA, June-July-August; LLJ, Low-Level Jet; MAM, March-April-May; MH, Mascarene High; NAO, North Atlantic Ocean Oscillation; NAOI, North Atlantic Ocean Oscillation Index; NCEP, National Center for Environmental Prediction; OND, October-November-December; SST, sea-surface temperature.
Competing Interest Statement: Both authors declare that they have no competing interests.
Author’s Contribution: M.Z. and T.L. designed and conducted this study, collected data, wrote and revised the manuscript.
Acknowledgments: Authors would like to thank NCEP-NCAR and (HadISST), as well as CPC, for available online data used for this study. The authors are also thankful to the People’s Republic of China Government and Kenya Meteorological Department for granting M.Z. a fellowship and study leave, respectively, without which this work will not have been possible.
References
Abera, T.A., J. Heiskanen, P. Pellikka, E.E. Maeda. 2018. Rainfall–vegetation interaction regulates temperature anomalies during extreme dry events in the Horn of Africa. Glob. Planet. Change. 167: 35-45.
Anyah, and W. Qiu. 2012: Characteristic 20th and 21st century rainfall and temperature patterns and changes over the Greater Horn of Africa. Int. J. Climatol. 32:347–363.
Appelhans, T., and N. Thomas. 2016. Spatial patterns of sea surface temperature influences on East African precipitation as revealed by empirical orthogonal teleconnections. Front. Earth Sci. 4: 3.
Ayugi, B., G. Tan, G.T. Gnitou, M. Ojara and V. Ongoma. 2020. Historical evaluations and simulations of precipitation over East Africa from Rossby centre regional climate model. Atmos. Res. 232:104705.
Black, E. 2005. The relationship between Indian Ocean sea–surface temperature and East African rainfall. Phil. Trans. R. Soc. A. 363: 43-47.
Broman, D., B. Rajagopalan, T. Hopson and M. Gebremichael. 2020. Spatial and temporal variability of East African Kiremt season precipitation and large‐scale teleconnections. Int. J. Climatol. 40: 1241– 1254.
Camberlin, P. and N. Philippon. 2002. The East African March–May rainy season: Associated atmospheric dynamics and predictability over the 1968–97 period. J. Clim. 15(9): 1002–1019.
Camberlin, P. 2018. Climate of Eastern Africa. Oxford Research Encyclopedia of Climate Science. https://doi.org/10.1093/acrefore/9780190 228620.013.512.
Camberlin, P., J. Boyard-Micheau, N. Philippon, C. Baron, C. Leclerc and C. Mwongera. 2014. Climatic gradients along the windward slopes of Mount Kenya and their implication for crop risks. Part 1: climate variability, Int. J. Climatol. 34(7), 2136–2152,
Camberlin, P., V. Moron, R. Okoola, N. Philoppon and W. Gitau. 2009. Components of rainy seasons’ variability in Equatorial East Africa: onset, cessation, rainfall frequency and intensity. Theor. Appl. Climatol. 98: 237–249.
Cattani, E., A. Merino, J.A. Guijarro, V. Levizzani. 2018. East Africa rainfall trends and variability 1983–2015 using three long-term satellite products. Remote Sensing. 10(6):931.
Chan, R. Y., M. Vuille, D.R. Hardy and R.S. Bradley. 2008. Intraseasonal precipitation variability on Kilimanjaro and the East African region and its relationship to the large-scale circulation. Theoret. Appl. Climatol. 93(3–4): 149–165.
Chen, Z., Y. Du, Z. Wen, R. Wu and S. P. Xie. 2019. Evolution of South Tropical Indian Ocean warming and the climatic impacts following strong El Niño events. J. Clim. 32: 7329–7347.
Cook, K.H. and E.K. Vizy. 2019. Contemporary Climate Change of the African Monsoon Systems. Curr. Clim. Change Rep. 5: 145–159.
Darand, M., M. Dostkamyan and M.I.A. Rehmani. 2017. Spatial autocorrelation analysis of extreme precipitation in Iran. Russian Meteorol. Hydrol. 42(6): 415-424.
Folland, C.K. 1983. Regional scale interannual variability of climate: A northwest European perspective. Meteorol. Magzine.112: 163-183.
Gong, D.Y., D. Guo, R. Mao, J. Yang, Y. Gao and S.J. Kim. 2016. Interannual modulation of East African early short rains by the winter Arctic Oscillation. J. Geophys. Res.: Atmos. 121(16): 9441–9457.
Haile, G.G., Q. Tang, S. Sun, Z. Huang, X Zhang and X. Liu. 2019. Droughts in East Africa: Causes, Impacts and resilience. Earth Sci. Rev. 193: 146- 161.
Indeje, M., F.H.M. Semazzi and L.J. Ogallo. 2000. ENSO signals in East African rainfall seasons. Int. J. Climatol. 20(1): 19-46.
Kerandi, N.M., P. Laux, J. Arnault and H. Kinstmann. 2017. Performance of the WRF model to simulate the seasonal and interannual variability of hydrometeorological variables in East Africa: a case study for the Tana River basin in Kenya. Theor. Appl. Climatol. 130: 401–418.
Kinuthia, J.H., and G.C. Asnani. 1982. A newly found jet in North Kenya (Turkana Channel). Mon. Weather Rev. 110(11): 1722-1728.
MacLeod, D. 2018. Seasonal predictability of onset and cessation of the east African rains. Weather Clim. Extreme. 21:27-35.
Manatsa, D., Y. Morioka, S.K. Behera, C.H. Matarira and T. Yamagata. 2014.. Impact of Mascarene High variability on the East African “short rains.” Clim. Dyn. 42(5–6):1259–1274.
Munday, C., R. Washington and N. Hart. 2020. African Low‐level jets and their importance for water vapour transport and rainfall. Geophys. Res. Lett. 47: 2020GL090999.
Ndomeni, C.W., E. Cattani, A. Merino and V. Levizzani. 2018. An observational study of the variability of East African rainfall with respect to sea surface temperature and soil moisture. Q. J. R. Meteorol. Soc. 144 (Suppl. 1): 384– 404.
Nicholson, S. 2016. The Turkana low‐level jet: mean climatology and association with regional aridity. Int. J. Climatol. 36: 2598-2614.
Nicholson, S.E. 2015. Long-term variability of the East African “short rains” and its links to large- scale factors. Int. J. Climatol. 35(13): 3979–3990.
Nicholson, S.E. 2017. Climate and climatic variability of rainfall over eastern Africa. Rev. Geophys. 55(3): 590–635.
Nicholson, S.E. 2018. The ITCZ and the seasonal cycle over Equatorial Africa. Bull. Am. Meteorol. Soc. 99(2): 337-348.
Nsubuga, F.W.N., O.J. Botai, J.M. Olwoch, C.J. DeW Rautenbach, Y. Bevis and A.O. Adetunji. 2014. The nature of rainfall in the main drainage subbasins of Uganda. Hydrol. Sci. J. 59(2): 278-299.
Nyakwada, W., L.A. Ogallo and R.E. Okoola. 2009. The Atlantic-Indian ocean dipole and its influence on East African seasonal rainfall. J.Meteorol. Rel. Sci. 3 21–35.
Oettli, P. and P. Camberlin. 2005. Influence of topography on monthly rainfall distribution over East Africa. Clim. Res. 28(3): 199–212.
Ogallo, L.J. 1988. Relationships between seasonal rainfall in East Africa and the Southern Oscillation. J. Climatol. 8(1):31–43.
Olayide, O.E. and T. Alabi. 2018. Between rainfall and food poverty: Assessing vulnerability to climate change in an agricultural economy. J. Clean. Prod. 198: 1-10.
Omondi, P.A., J.L. Awange, E. Forootan, L.A. Ogallo, R. Barakiza, G.B. Girmaw, I. Fesseha, V. Kululetera, C. Kilembe, M.M. Mbati, M. Kilavi, S.M. King’uyu, P.A. Omeny, A. Njogu, E.M. Badr, T.A. Musa, P. Muchiri, D. Bamanya and E. Komutunga. 2014. Changes in temperature and precipitation extremes over the Greater Horn of Africa region from 1961 to 2010. Int. J. Climatol. 34(4): 1262–1277.
Ongoma, V., H. Chen and C. Gao. 2019. Evaluation of CMIP5 twentieth century rainfall simulation over the equatorial East Africa. Theor. Appl. Climatol. 135: 893–910.
Ongoma, V., H. Chen and G.W. Omony. 2018. Variability of extreme weather events over the equatorial East Africa, a case study of rainfall in Kenya and Uganda. Theor. Appl. Climatol. 131: 295–308.
Park, C., D‐H. Cha, G.Kim, G. Lee, W.-S. Suh, S.Y Hong, J.B. Anh and S.K. Min. 2020. Evaluation of summer precipitation over Far East Asia and South Korea simulated by multiple regional climate models. Int. J. Climatol. 40: 2270– 2284.
Peixoto, J.P., and A.H. Oort. 1992. Physics of Climate. American Institute of Physics, New York
Raikes, J., T.F. Smith, C. Jacobson and C. Baldwin. 2019. Pre-disaster planning and preparedness for floods and droughts: A systematic review. Int. J. Disaster Risk Reduct. 38:101207.
Ratna, S.B., A. Cherchi, T.J. Osborn, M. Joshi and U. Uppara. 2020. The extreme positive Indian Ocean Dipole of 2019 and associated Indian summer monsoon rainfall response. Geophys. Res. Lett. 47: e2020GL091497.
Rayner, N.A., D.E. Parker, E.B. Horton, C.K. Folland, L.V. Alexander, D.P. Rowell, E.C. Kent and A. Kaplan. 2003. Global analyses of sea surface temperature, sea ice, and night marine air temperature since the late nineteenth century. J. Geophys. Res. Atmos. 108(D14): 4408.
Saji, N. H., B.N. Goswami, P.N. Vinayachandran and T. Yamagata. 1999. A dipole mode in the tropical Indian ocean. Nature. 401(6751): 360–363.
Schlueter, A. 2020. Synoptic to intraseasonal variability of African Rainfall. Oxford Research Encyclopedia of Climate Science. https://doi.org/10.1093/acrefore/9780190228620.0 13.522.
Sein, Z.M.M., B.A. Ogwang, V. Ongoma, F.K. Ogou and K. Batebana. 2015. Inter-annual variability of summer monsoon rainfall over Myanmar in relation to IOD and ENSO. J. Environ. Agric. Sci. 4:28-36.
Seregina, L.S., A.H. Fink, R. van der Linden, C. Funk and J.G. Pinto. 2020. Using seasonal rainfall clusters to explain the interannual variability of the rain belt over the Greater Horn of Africa. Int. J. Climatol. https://doi.org/10.1002/joc.6802.
Shilenje, Z.W., V. Ongoma and B. Ogwang. 2015. Relationship between the North Atlantic Oscillation Index and October-December Rainfall Variability Over Kenya. J. Geol. Geophys. 4(3):1- 5.
Souverijns, N., W. Thiery, M. Demuzere, and N.P.M.V. Lipzig. 2016. Drivers of future changes in East African precipitation Drivers of future changes in East African precipitation, Environ. Res. Lett. 11: 1–9.
Sutanto, S.J., C. Vitolo, C.D. Napoli, M. D’Andrea, H.A.J. Van Lanen. 2020. Heatwaves, droughts, and fires: Exploring compound and cascading dry hazards at the pan-European scale. Environ. Int. 134: 105276.
van der Plas, G.W., G. De Cort, N. Petek-Sargeant, Ta. Wuytack, D. Colombaroli, P.J. Lane, D. Verschuren. 2019. Distinct phases of natural landscape dynamics and intensifying human activity in the central Kenya Rift Valley during the past 1300 years. Quater. Sci. Rev. 128: 91-106.
Wakachala, F.M., Z.W. Shilenje, J. Nguyo, S. Shaka and W. Apondo. 2015. Statistical patterns of rainfall variability in the Great Rift Valley of Kenya. J. Environ. Agric. Sci. 5:17-26.
WWF (World Wide Fund for Nature), 2006: Climate Change Impacts on East Africa: A review of the scientific literature, Gland Switzerland, World Wide Fund for Nature.
Xie, P. and P.A. Arkin. 1996. Analysis of global monthly precipitation using gauge observation, satellite estimates and numerical model predictions. J. Clim. 19(4): 840-858.
Yang, T.H. and W.C. Liu. 2020. A general overview of the risk-reduction strategies for floods and droughts. Sustainability.12: 2687.
Zhao, S., J. Li, Y. Li, F. Jin and J. Zheng. 2019. Interhemispheric influence of Indo-Pacific convection oscillation on Southern Hemisphere rainfall through southward propagation of Rossby waves. Clim. Dyn. 52: 3203–3221.
Join Journal of Environmental and Agricultural Sciences (JEAS)Interested to join the JEAS Team
Join JEAS as a member Editorial Board see Editors’ Responsibilities
Join JEAS as a member Review Panel Reviewers’ Responsibilities
(send your CV through email at editor.jeas@outlook.com)
JEAS Indexing Journal of Environmental EAS is indexed by reputed indexing services.
Suggest Indexing service/s through email (editor.jeas@outlook.com)
Call for Articles
Submit Your research for publication in the “Journal of Environmental and Agricultural Sciences (JEAS)” through email: editor.jeas@outlook.com
- How to prepare your manuscript before submission
- How to submit your manuscript
- Publication Ethics
- Publication Fee Currently JEAS is publishing manuscripts without publication or processing fee
JEAS Recently Published and Highly Cited Articles
Citation record of JEAS: JEAS Google Scholar page
Follow JEAS Facebook